Direxion Daily S&P 500 Bull 3X Shares (SPXL)
$250.09
Quotes are delayed by 15 minutes.
1D
1W
1M
3M
6M
YTD
1Y
2Y
5Y
ALL
Key data on SPXL
AUM
$6.08B
P/E ratio
23.7
Dividend yield
0.5385%
Expense ratio
0.84%
Beta
3.026613
Price on SPXL
Previous close
$265.10
Today's open
$260.15
Day's range
$247.98 - $260.29
52 week range
$168.04 - $303.18
Popular funds like SPXL
SPXL industries and sectors
Equities
Multi Alternative
Top holdings in SPXL
11.62%
8.14%
5.48%
News on SPXL
Stock Market: Will S&P 500 Open Up or Down Today?
U.S. stock futures are trending modestly higher early Wednesday as Wall Street digests a massive earnings beat from Nvidia Corp. (NASDAQ:NVDA) alongside ongoing geopolitical tensions in the Middle East.

Benzinga • 2 hours ago

The Stock Market Is Doing Something for Just the 3rd Time in Nearly 30 Years, and History Is Clear Where the S&P 500 Is Headed
The Shiller CAPE ratio measures stock market valuations over a long-term time horizon. Historically speaking, readings of 40 or above signal unusually high valuations.

The Motley Fool • 21 hours ago

Prediction: Dec. 9 Will Mark a Turning Point for the S&P 500
On Dec. 9, the Fed makes its next decision on interest rates. A rate hike looks to be all but certain, and there's even a chance it could be a half-point increase.
The Motley Fool • 18 hours ago

The Stock Market Is Doing Something for Only the Second Time in 155 Years. Here's What History Says Could Come Next.
The S&P 500 hasn't been this expensive since the dot-com bubble. However, the companies driving today's high valuation are far more established.
The Motley Fool • 17 hours ago

The S&P 500 is testing a key technical floor. Is it time to buy, or brace for a bear market?
The S&P 500 is joining other major U.S. equity indexes in trading below its 200-day moving average as the artificial-intelligence trade continues to struggle.

Market Watch • 12 hours ago

S&P500 and Nasdaq Index: Tech Sell-Off Puts 200-Day Averages in Focus
The S&P 500 and Dow break below their 200-day moving averages as semiconductor selling pressures U.S. stocks ahead of Nvidia earnings.

FXEmpire • 11 hours ago

Bear Market Watch: What the Charts Say About the S&P 500
History suggests that when a bear market takes hold, it eventually comes for all stocks.

Barrons • 16 hours ago

The S&P 500 Looks Cheaper Than It Has in Over 3 Years, but There's a Catch
The S&P 500's forward P/E reached its lowest level since November 2023 this month. Corporate earnings have trounced expectations so far this year, pushing analysts' expectations higher.
The Motley Fool • Nov 16, 2026

The S&P 500 Is on Pace to Do Something That's Only Happened 3 Times in History
The S&P 500 has had three instances of four consecutive years of double-digit percentage increases. Much of the S&P 500's gains since the 2022 bear market have been driven by a handful of mega-cap tech stocks.
The Motley Fool • Nov 16, 2026

Here's How the S&P 500 Has Moved the Day After Each of Nvidia's Last 12 Reports
The S&P 500 climbed the day after seven of Nvidia's last 12 earnings reports and dropped after five. On these 12 days, the index's average move was almost exactly zero.
The Motley Fool • Nov 16, 2026

¹ Disclosures
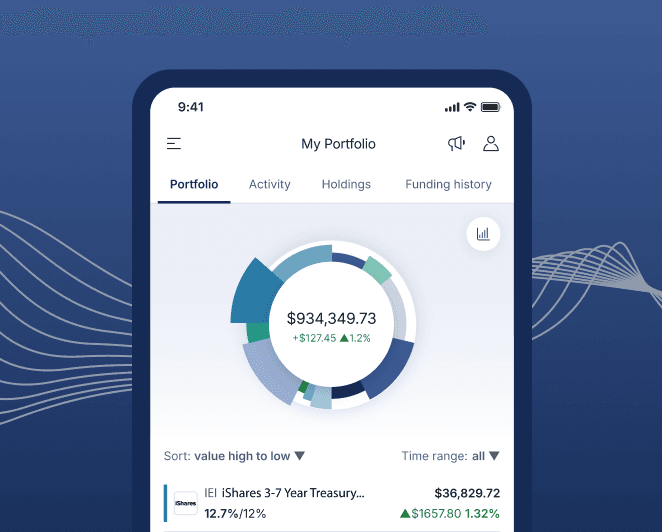
Invest in Direxion Daily S&P 500 Bull 3X Shares
Open an M1 investment account to buy and sell Direxion Daily S&P 500 Bull 3X Shares commission-free¹. Build wealth for the long term using automated trading and transfers.