Bear market? We’ve seen this before

Today’s roundup includes the recent history of bear markets, a new international partnership, and a tough week for social media giants.
Also in this edition:
- 2022’s richest athletes
- A new report from the Fed
- 100 years of auto history
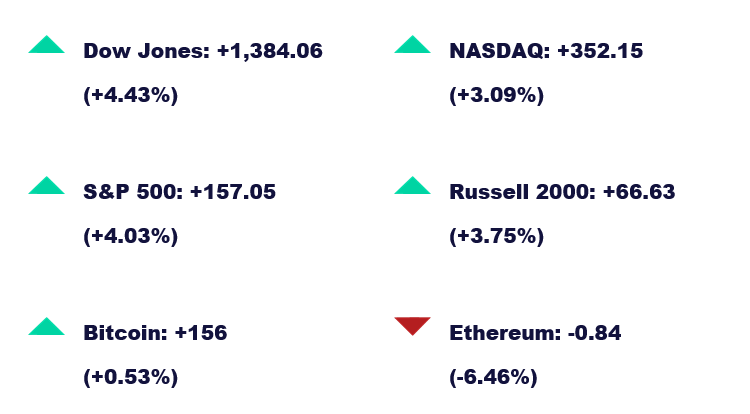
Here’s how the markets performed this week:

News
A brief history of bear markets
As the S&P dipped last Friday, it met the criteria of a bear market. The news has been taking over headlines, but what officially signals the swap from a bull market?
A bear market is in effect when an index falls 20% or more from a recent high. And for a time on Friday, the S&P was down 20% from its January peak.
Will this run be like the others? Bespoke Investment Group points out that “no two bear markets are exactly alike” and that eight out of 14 prior bear markets since World War II have preceded recessions (the other six did not).
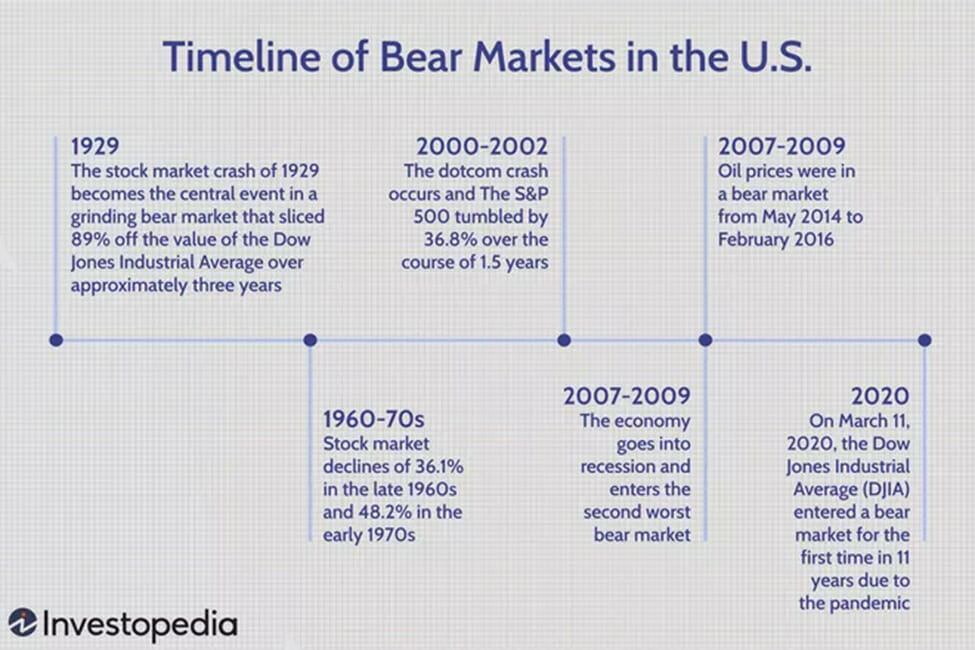
Here’s a look at past bear markets:

Keep in mind, a recession on the back end of a bear market can affect stock performance. Those that occur before a recession are more prolonged (lasting 449 days compared to 198 days with no recession) with steeper losses (an average decline of 35% compared to 28%), according to Bespoke.
US announces Asian economic deal
On Monday, the US announced aan alliance with Japan, South Korea, and Australia for for the Indo-Pacific Economic Framework. The wide-ranging plan is designed to grow America’s “economic leadership” in the Indo-Pacific territory.
The group aims to set rules regarding:
- Supply chains
- Worker’s regulations
- Decarbonization
- The digital economy
President Biden says the framework may help lower costs by fortifying supply chains, with the hope of chipping away at domestic inflation.
SNAP out of it
Snap (SNAP) shares dropped 40% on Tuesday morning. As the social media network heads for its worst day in history, it’s dragging down other social platforms with it.
This drop follows Snap’s warning to investors that it won’t meet revenue and earnings targets this quarter.
“Since we issued guidance on April 21, 2022, the macroeconomic environment has deteriorated further and faster than anticipated,” Snap said in an SEC filing. Shares are down 83% from a 52-week high in September 2021 and an overall 70% year to date.
Here’s how the news affected other tech companies:
- Meta: -9%
- Pinterest: -26%
- Alphabet: -8%
- Twitter: -3%
Quick hits
- Forbes shares the 50 highest-paid athletes of 2022
- US households felt great about finances as inflation soared
- Tether stablecoin withdrawals top $10 billion
M1verse
Well, well, wellness
Our new and improved investor’s guide to financial wellness is here. In this guide, you’ll learn:
- What is financial wellness?
- How you can attain financial wellness
- How to start your financial wellness journey
No matter where you are in your investing journey, you can find helpful tips for staying on the path to financial wellness.

This week in finance history
May 26, 1927
The last Model T drives off the assembly line. Ford produced over 15 million Model Ts in the 19 years their signature car was in production. This run was the longest in automotive history for almost half a century, until the Volkswagen Beetle passed it in 1972.
So, what’s changed over the last century? Let’s compare.
US vehicle production:
- 1928: 4.36 million
- 2021: 9.16 million
Ford advertising:


Sign up for M1 to receive weekly market insights and financial wellness tips in your inbox.
- Categories
- Invest


