How to research stocks: are you investing like the experts?

Every year millions try to beat the stock market. And let’s be honest, it’s hard, if not nearly impossible. Many investors choose to invest for the long term, but even then, there are dozens of ways to do that—and many of them involve research.
This is why many invest in index funds, so they’ll at least (hopefully) match the market’s returns with minimal research needed. But for those who like to have more control over their investments, how do they make their decisions?
When you research stocks, the main goal is finding the difference between the market price and a stock’s intrinsic value (fair value). Intrinsic value, or fair value, can mean things like business model or leadership—anything that doesn’t impact supply and demand.
When investing for the long-term, you are not just buying a stock; you are purchasing a piece of the business. So whether you’re a beginner investor or someone with more experience, here’s our take on how to research stocks:
- Discover your approach to researching stocks
- Find your tools
- Stock price and other quantitative research
- Interview the company
- Keep up with the news
- Build your strategy
Discover your approach to researching stocks
As a long-term investor doing your stock research, you must adopt some type of stock analyst mindset. And the good news is, you don’t need a degree to do it. There are three types of investment approaches when it comes to analyzing stocks. Picking the right path depends on your timeline and goals.
Fundamental analysis
Do you see yourself as a Warren-Buffett-type? Buffett uses fundamental analysis to examine a company’s financial statements and makes predictions about its future. They examine metrics such as cash flow, return on assets, and profit retention. They also evaluate its systems like its management structure, revenue model, and industry sector.
Fundamental analysis helps investors form opinions from consumer reports of news that impact a company’s fundamentals. Their goal is to determine the company’s intrinsic value and spot the difference between the current price in the market. Fundamental analysts look for long-term investments.
Technical analysis
Or do you see yourself as John Magee, known for his pattern-influenced decision-making?
If you like finding patterns, you may prefer technical analysis. This approach cares less about a company’s intrinsic value and more about how the price will move in the future. They look for the details of each decision and price movement through long-term patterns.
Technical analysts try and figure the strengths and weaknesses of a stock. They look at market psychology and how the stock has reacted to previous events. Day-to-day news, over time, matters. They may even look at chart history to influence decision-making, however, history doesn’t always repeat itself and is not necessarily indicative of future performance.
Technical analysts are often thought of as short-term focused but many of their techniques can also inform long-term strategy.
Blended analyst
Can’t decide? Sometimes, a blend of both types of analyses gives investors the most holistic understanding of the stock. Many smart investors use this blended analysis for their long-term mindset. It focuses on the fundamentals without ignoring the technical approaches.
Find your tools
Any approach to analyzing stocks starts by researching the company and reviewing its financials. There are dozens of tools available to long-term investors researching stocks.
Research sites
Many sites on the internet provide free stock research and data collection. Yahoo! Finance, Google Finance, The Wall Street Journal, and Morningstar are great places to start.
In your investing app
Your money management platform may offer research capabilities more specific than a general research site.
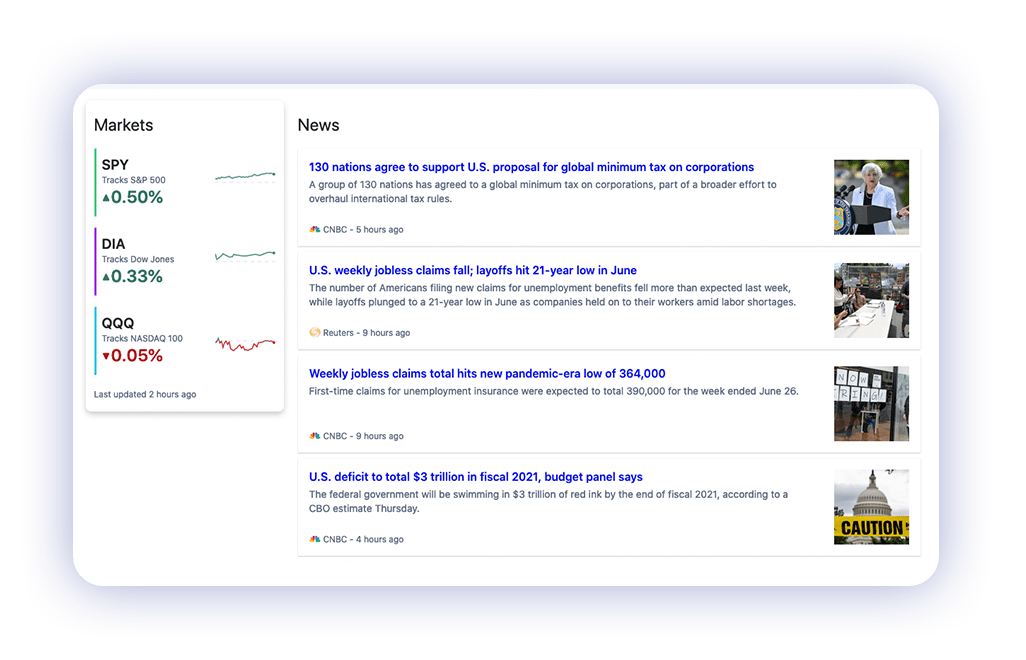
For example, we have a Research tab in our platform that aggregates market news, research, and investment data. You can add stocks to your Watchlist and pay attention to news that pertains explicitly to those stocks or look up any new stocks of interest.

10-Ks and 10-Qs
Other research tools include the 10-K annual report and 10-Q quarterly report. These documents are financial statements public companies are required to file with the U.S. Securities and Exchange Commission. They give insight into the nuts and bolts of the business and highlight things like a company’s balance sheet, income, revenue, expenses, and investments.
The stock price can reflect what’s happening in the present day, but a company’s financial documents can give you a deep dive into the health of a company.
For example, read through Berkshire Hathaway’s 2020 Form 1-K.

Earnings calls
An earnings call is a conference call between the management of a publicly-traded company and its investors each quarter. An earnings report is simultaneously published with the earnings call. Earnings reports include three key financial statements: the balance sheet, the income statement, and the cash flow statement. They give insight into sales, expenses, a company’s revenue, and earnings per share (EPS).
During the call, company leadership discusses the company’s 10-K and 10-Q filings and other aspects of the company’s financials as it pertains to earnings. The MD&A section (management discussion and analysis) provides a discussion on performance from the leadership level. They also discuss growths, risks, and outline future plans for the company.
SEC EDGAR portal
The Securities and Exchange Commission provides a collection of all publicly traded company financials in their EDGAR portal. This government database is completely free and open to the public.

Stock price and other quantitative research
So, you’ve found the financials and looked at them in the context of research sites. But what does it all mean? This is where quantitative research comes into play. When reviewing stocks, investors look for these key metrics. Let’s pull the numbers.
Market capitalization
Market capitalization is a company’s day-to-day worth as determined by the stock market. It is calculated by the total market value of all outstanding shares. Companies are divided into either large-cap stocks ($10 billion or more), mid-cap stocks ($2 billion to $10 billion), and small-cap stocks ($300 million to $2 billion).
Large-cap stocks tend to have more mature business models than smaller-cap stocks. They have often weathered through several market cycles and have proven revenue models. However, they may have less room to grow than smaller-cap stocks. Many long-term investors (and wealth management firms) set a market cap minimum for themselves—it acts as a guideline in stock research.
Quick ratio
The quick ratio measures a company’s ability to pay its current liabilities without needing other financing or selling off its inventory. The higher the ratio, the better (X>1). This indicates the company has more liquidity and financial health to pay the company’s debt and other liabilities.
Net profit margin
This measures how much net income is generated as a percentage of revenues received. This gives investors insight into whether the company generates a profit while still maintaining operating costs and containing overhead.
Return on Assets
ROA is an indicator of how well a company utilizes its assets in terms of profitability. Investors compare ROA between similar companies or a company’s past performance.
Earnings per share
EPS indicates how much money a company makes for each share of stock. The higher, the better. This indicates greater value because investors will pay more for a company’s shares if they think the company has high profits relative to its share price.
Price-to-earnings (p/e) ratio
One of the ways to find value stocks is the price-to-earnings ratio. It indicates the dollar amount an investor should expect to invest in a company to receive one dollar of its earnings. If a company’s stock price is $50 and its EPS is $10, its P/E ratio would be 5. A high P/E can mean the stock is overvalued, while a low P/E can mean the stock is undervalued. Investors tend to look for stocks with a P/E ratio in the bottom 10% of their respective sectors.
Earnings yield
The earnings yield refers to the earnings per share for the most recent 12-month period divided by the current market price per share. The earnings yield is the inverse of the P/E ratio.
Price-to-sales ratio
The P/S ratio shows how much investors are willing to pay per dollar of sales for a stock. A low ratio can indicate that the stock is undervalued, while a high ratio can indicate that the stock is overvalued.
Debt/equity ratio
The debt-to-equity ratio compares a company’s total liabilities to its shareholder equity and can be used to evaluate how much leverage a company is using. Higher leverage ratios tend to indicate a company or stock with higher risk to shareholders.
Cash flow
Cash flow refers to the movements of money in and out of a business, typically categorized as cash flows from operations, investing, and financing. Operating cash flow is all cash generated by the company’s core business. Investing cash flow is the company’s assets and investments. Financing cash flow is all proceeds gained from issuing debt and equity. This information tells an investor if the business can make money and how they spend that money. How a business spends its money is equally as important to how a business makes its money. This can clue an investor into any possible growths or risks down the line.
EBITDA/EV
EBITDA stands for earnings before interest, taxes, depreciation, and amortization, while EV stands for enterprise value. This includes a company’s market cap, as well as its debt and any cash on its balance sheet.
The EBITDA/EV ratio is used to calculate a company’s ROI or return on investment and can be helpful when comparing companies.
Interview the company
Qualitative research is just as important as quantitative research. Many factors affect a stock’s price besides its financials. Business plans, leadership, lawsuits, and the media all can influence a stock’s price and fair value. When balanced with quantitative data, qualitative data can help further inform your strategy and investment choices.
One strategy is “interviewing” the company. You are interviewing the company for a role in your portfolio. What questions do you ask? Some starting options are:
- What does the company do?
- How does it make money?
- Where does it compare within its sector?
Once you’ve done your research, begin developing your investment thesis. Like any interview, you want to see if the company is the right fit for you.
- Is this stock a buy, hold, or sell case?
- How does it fit into your portfolio overall?
After culture fit, the next step of any interview is usually “Where do you see yourself in 5 years? 10?” As investors with a long-term mindset, this question is crucial to the research process.
- Does it have long-term potential?
- What will its growth look like?
- What risks face it?
- How could it fail?
Keep up with the news
Like a sponge, a smart investor wants to absorb relevant, helpful information. Ultimately, what you choose to do with the stock is up to you—but smart investors rarely make decisions in an echo chamber. The media, other financial institutions, friends, and your favorite finance Twitters account may have some insight that could allow you to explore further.
You can do this by reading news stories about your holdings, focusing on stories from reputable publications and journalists. Analyze what is moving the company or industry in the long term. Read stories about your holdings’ corporate structure and mergers and acquisitions. Read about the industry. Consider any lawsuits your holdings are facing and their potential long-term impact. And, evaluate the impact local and global events can have.
You can also do this by reading how other institutions view this particular stock. Many advisors and wealth management firms publish thought pieces for free. And just like the news, it’s up to you to interpret and adapt the information as needed.
Build your strategy
There are endless metrics investors can consider when analyzing a stock and its intrinsic (fair) value. But research is meaningless without interpretation.
So once you’ve done your research, it’s time to contextualize it. Build a well-informed narrative of each stock you’re considering to determine its intrinsic value and whether it is worth buying.
There’s no one true way to predict the future, but if you’re looking to minimize risk and maximize return, research publicly traded companies. The information is out there and available to anyone—and we’re working to make it easier to understand and act on.
“Everybody can read what I read, it is a level playing field.”
—Warren Buffett
P.S. Ready to optimize your investment strategy? Find out your risk tolerance.
M1 does not endorse and is not affiliated with any companies mentioned in this blog.
- Categories
- Invest


