How we use machine learning to predict client assets

Retail investors have a broad spectrum of financial backgrounds and investment needs that drive their appetite for investment platforms. That’s why we designed our M1 Invest product for investment customization and automation. While we offer a true product differentiator in the investment space, it may not be a perfect fit for all customers.
This brings us to a critical customer acquisition efficiency challenge: How do we market our platform to investors who are likely to benefit from M1 Invest and grow their wealth with M1?
Our data science team set out to find the answer using machine learning.
Predicting assets with machine learning
At M1, we value and appreciate all investors on our platform. We want our users to grow their investments with us, and we measure success by the value of assets our users trust us to manage. These investments are commonly referred to as assets under management (AUM).
Each marketing initiative at M1 helps us acquire new clients, who contribute AUM on the platform. As we continue to reach new users, we want to make sure we do so in a cost-effective way. Specifically, our data science team worked on an optimization solution to increase AUM at efficient marketing costs.
In a perfect world, we would know the precise AUM value for each marketing initiative. While the ideal state may not be realistic, our data science team developed an expected assets under management model to help the marketing team identify channels that are expected to make a significant contribution.
So we set out to build a model that predicts each client’s expected AUM, several months after opening their account. Our intention was to use the respective predictions to help our marketers improve acquisition efficiencies across channels, tactics, and ad copy.
Diving into the data
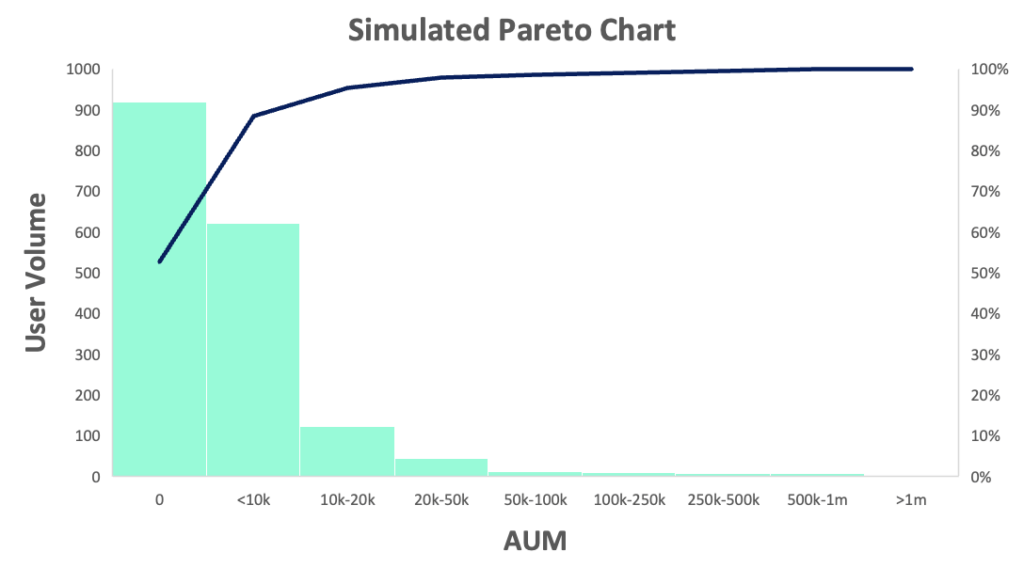
As with any data science problem that involves machine learning, it’s important to understand the features in a dataset. Upon user sign-up, we ingested financial profiles and early usage data into the model. Much like many other problems in the financial services space, our target variable AUM is skewed.
While we can’t illustrate the distribution of our actual clients’ data, below is a simulated Pareto chart visualization to provide directional perspective.

The skewness of the data caused challenges for us as we tried to evaluate our model’s performance. We knew not everyone ends up adding money onto M1 within the time frame of interest. And this caused our AUM to be zero heavy.
Solving for the distribution
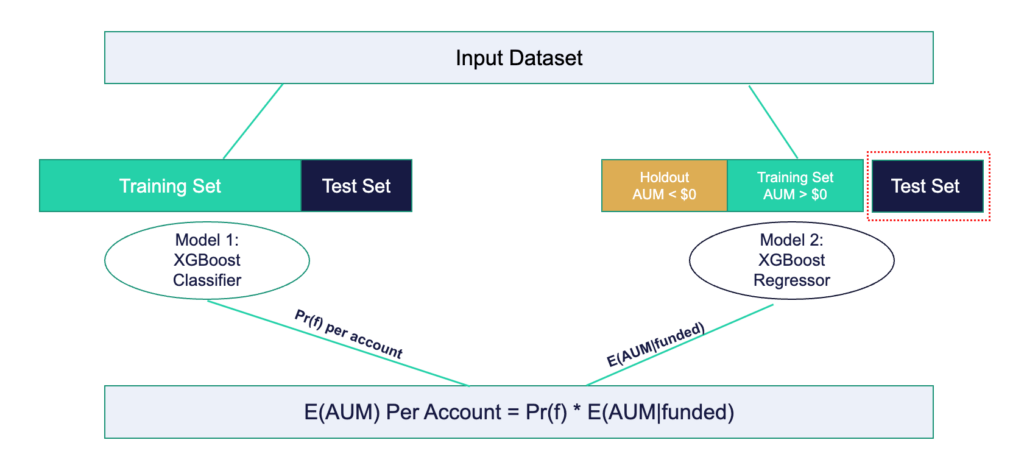
We used a Hurdle modeling construct to help us handle excess zeroes and overdispersion. Hurdle models can be built in many ways. But we built ours as an ensemble of a classification and a regression model.

The classification model predicts the likelihood that a user will have AUM on the platform. This binary classification takes the same input variables—financial profile and early behaviors—and produces a probability between 0 and 1.
The regression model uses a similar dataset, but we narrowed the training observations to only those users who have non-zero AUM. This is referred to as “conditioning” our model. By conditioning our model on users who funded their respective accounts, we got a prediction—given positive AUM account balance. At that point, we no longer needed to solve for the excess zeroes in our regression model. We could use standard regression performance metrics to evaluate the model.
To make the two models useful for our marketing team, we needed to combine the predictions into one output. To derive our key modeling value for this initiative, estimated AUM, we multiplied the resulting probability prediction from the classification model by AUM if funded from the regression model. The mathematical notation is as follows:
e(AUM) = Pr(f) * E(AUM|Funding)
The resulting output e(AUM) is the expected assets under management.
Creating a useful machine learning model
Machine learning models only become valuable when they’re used by stakeholders. Here at M1, our internal teams are willing to use our production models and are engaged in the modeling process. And they often provide critical input to shape our deliverables.
Since deploying and automating our model, the marketing team can get the metrics they need. Now, they can use the estimated AUM scores to evaluate the success of their recent initiatives on-demand and strategically plan for future initiatives.
Learn more about the product that inspired this model, M1 Invest.
About the author: Josh Bender is a Data Scientist at M1.
- Categories
- M1


