M1 releases dashboard updates with expanded data and charts

Part of M1’s mission is giving our clients excellent data through easy-to-use tools to make their own investing decisions. Today, M1 launched an upgraded chart for our clients, giving investors expanded insights into their portfolio performance.
Here’s what we’ve built, and how you can use it to your benefit.
Chart Enhancements
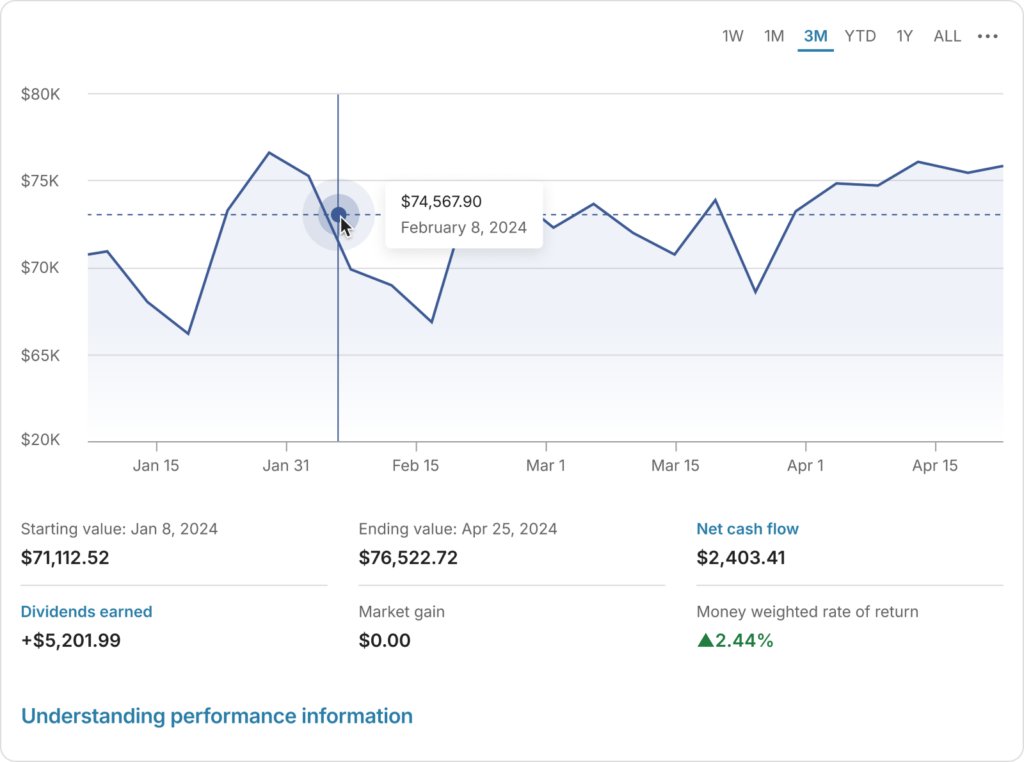
Historically, our platform has had a value-over-time chart, giving a look into overall investment performance over a fixed time period such as one month or three years.
Popular data points like total dividends earned, overall market gains, and money-weighted rate of return have been added below the chart for a full picture of your portfolio performance.

Where clients can find this, and how to use it
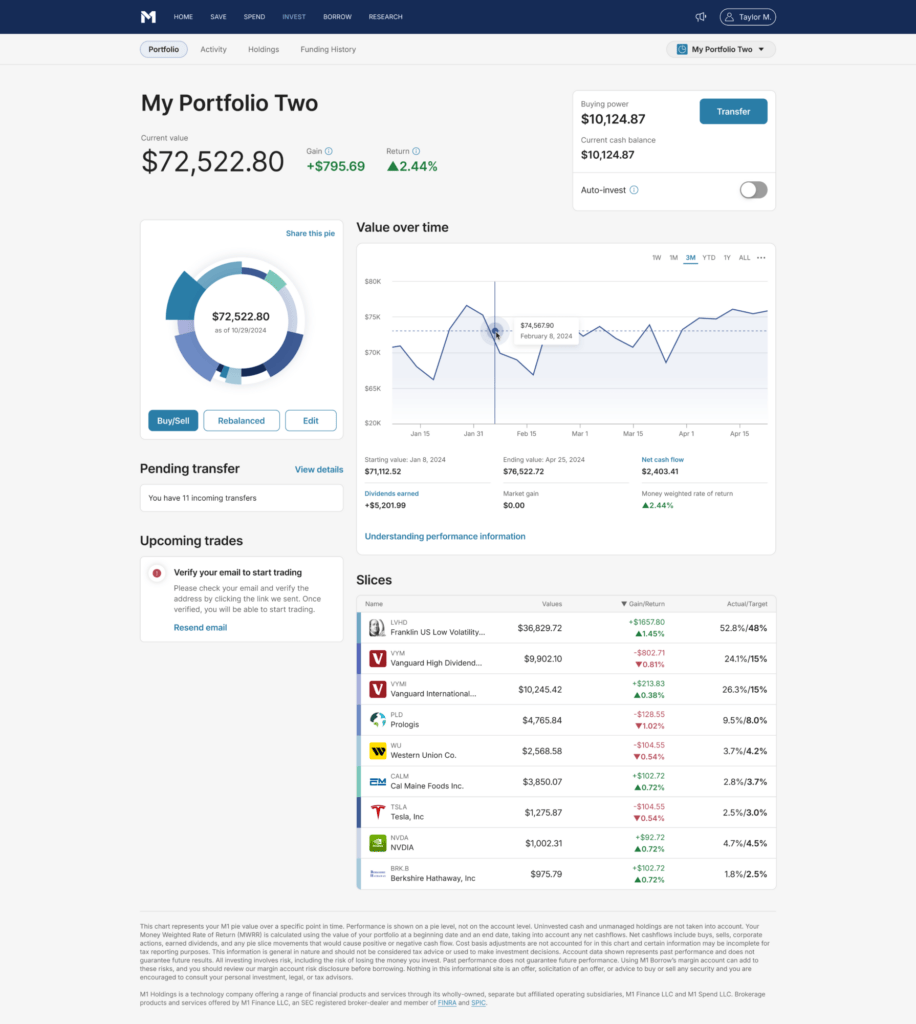
This is now live for all of our active clients on desktop, and you can access it simply by logging into your account and viewing your investing dashboard. It will look just like this.

We’re aiming to build this into the M1 mobile app in the near future.
Bottom line
The M1 team is continuing to build expanded tools for our clients to have the best tools for a long-term investing journey. We just launched expanded connectivity with Plaid to third-party services like budgeting apps, and we’ve got plenty more on the way in the new year.
All investing involves risk, including the risk of losing the money you invest. Brokerage products and services are offered by M1 Finance LLC, Member FINRA / SIPC, and a wholly owned subsidiary of M1 Holdings, Inc.
All examples above are hypothetical, do not reflect any specific investments, are for informational purposes only, and should not be considered an offer to buy or sell any products. M1 does not provide any financial advice.
20231211-3264517-10401617
- Categories
- M1


